How to Make HTML Table Labels in Graphviz
To draw a table inside a Graphviz node, set shape=plain and give the node an HTML-like label: label=< <TABLE> ... </TABLE> >. Use <TR> for rows and <TD> for cells, COLSPAN for a header that spans the columns, and CELLBORDER/CELLPADDING for the grid. Escape &, < and > in cell text as &, < and >.
Build a table with a header and data rows
digraph Order {
node [shape=plain];
order [label=<
<TABLE BORDER="0" CELLBORDER="1" CELLSPACING="0" CELLPADDING="6">
<TR><TD COLSPAN="2" BGCOLOR="lightblue"><B>Order</B></TD></TR>
<TR><TD ALIGN="LEFT">id</TD><TD ALIGN="LEFT">UUID</TD></TR>
<TR><TD ALIGN="LEFT">items</TD><TD ALIGN="LEFT">List<LineItem></TD></TR>
<TR><TD ALIGN="LEFT">total</TD><TD ALIGN="LEFT">price & tax, in cents</TD></TR>
</TABLE>
>];
}
Run the header-and-rows example in the Graphviz editor
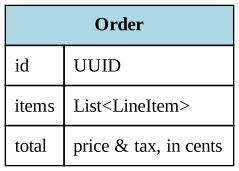
- The label is delimited by
<and>instead of quotes. That outer pair is what makes it an HTML-like label. - The header
<TD>hasCOLSPAN="2"so it covers both columns,BGCOLORfor the fill, and<B>for bold text. ALIGN="LEFT"left-aligns text inside each data cell; the column is still as wide as its longest value.List<LineItem>andprice & taxrender asList<LineItem>andprice & tax.
Choose borders, cell spacing and padding
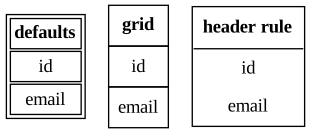
The same three rows with three different <TABLE> settings:
digraph Borders {
  node [shape=plain];
  defaults [label=<
    <TABLE>
      <TR><TD><B>defaults</B></TD></TR>
      <TR><TD>id</TD></TR>
      <TR><TD>email</TD></TR>
    </TABLE>
  >];
  grid [label=<
    <TABLE BORDER="0" CELLBORDER="1" CELLSPACING="0" CELLPADDING="6">
      <TR><TD><B>grid</B></TD></TR>
      <TR><TD>id</TD></TR>
      <TR><TD>email</TD></TR>
    </TABLE>
  >];
  header_rule [label=<
    <TABLE BORDER="1" CELLBORDER="0" CELLSPACING="0" CELLPADDING="6">
      <TR><TD BORDER="1" SIDES="B"><B>header rule</B></TD></TR>
      <TR><TD>id</TD></TR>
      <TR><TD>email</TD></TR>
    </TABLE>
  >];
}
Run the border comparison in the Graphviz editor
| Attribute | Where | What it controls |
|---|---|---|
BORDER | <TABLE> or <TD> | Outline width of the table or one cell. |
CELLBORDER | <TABLE> | Default border width for every cell. It falls back to the table's BORDER. |
CELLSPACING | <TABLE> | Gap between cells, and between cells and the table border. |
CELLPADDING | <TABLE> or <TD> | Space between a cell's border and its text. |
SIDES | <TD> | Which sides of a cell's border to draw, using L, T, R and B. |
A bare <TABLE> draws a table border and cell borders with a gap between them, which looks like double lines (defaults). BORDER="0" CELLBORDER="1" CELLSPACING="0" gives a single-line grid (grid), the usual choice for entity and record tables. For a lighter table, turn cell borders off and draw only a rule under the header with BORDER="1" SIDES="B" on that cell (header rule). CELLPADDING="6" gives the text room in the last two tables.
Escape text inside cells
An HTML-like label must be well-formed XML. A bare & fails:
digraph Order {
  node [shape=plain];
  order [label=<
    <TABLE BORDER="0" CELLBORDER="1" CELLSPACING="0" CELLPADDING="6">
      <TR><TD><B>Order</B></TD></TR>
      <TR><TD>price & tax</TD></TR>
    </TABLE>
  >];
}
Open the broken example in the Graphviz editor
Graphviz 9.0.0 reports not well-formed (invalid token) in line 4 and does not draw the graph. Replace the cell text with price & tax to fix it. A bare < is a syntax error too (the message says missing '>'?), and so is a bare >, because it closes the label early. Write them as < and >. A double quote does not need escaping inside an HTML-like label. A missing </TR> or other mismatched tag also fails, with mismatched tag.
Use shape=plain, not shape=box
digraph Shapes {
  plain_node [shape=plain, label=<
    <TABLE BORDER="0" CELLBORDER="1" CELLSPACING="0" CELLPADDING="6">
      <TR><TD><B>shape=plain</B></TD></TR>
      <TR><TD>id</TD></TR>
    </TABLE>
  >];
  box_node [shape=box, label=<
    <TABLE BORDER="0" CELLBORDER="1" CELLSPACING="0" CELLPADDING="6">
      <TR><TD><B>shape=box</B></TD></TR>
      <TR><TD>id</TD></TR>
    </TABLE>
  >];
}
Run the shape comparison in the Graphviz editor
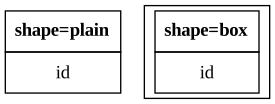
With shape=box, Graphviz draws the node's own rectangle around the table and adds margin, so the table gets a second outline. shape=plain has no outline, no margin and no minimum size, so the node is exactly the table. shape=none also hides the outline, but it keeps the default margin and minimum node size, so a small table takes extra space in the layout.
Next steps
These examples were rendered with this site's Graphviz 9.0.0 dot engine, which accepts upper- or lowercase tag names. To connect edges to a particular cell, add PORT="name" to its <TD> and follow connecting Graphviz edges to node sides and table ports. For a quick bold line or line break without a table, see multiline Graphviz labels. The database ERD example shows a complete schema built from table labels, and the Graphviz cheatsheet covers general DOT syntax.
Reference: Graphviz HTML-like labels.