Graphviz Examples
Practical, ready-to-run Graphviz (DOT) examples — architecture diagrams, ERDs, flowcharts, decision trees, subgraphs and more. Click any example to open it in the interactive Graphviz playground, then edit the DOT source and see the diagram render instantly.
system design
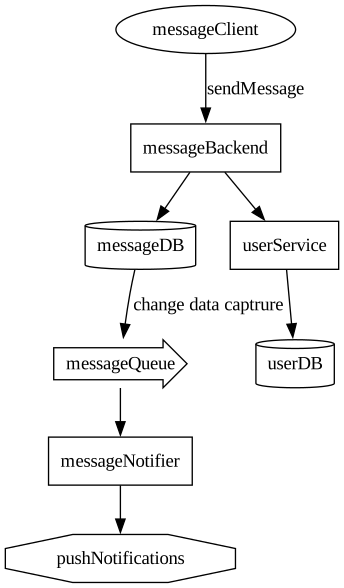
A Graphviz example showing how to draw a system architecture diagram with digraph, node shapes (cylinder for databases, rarrow for a queue) and labelled edges.
entity relationships
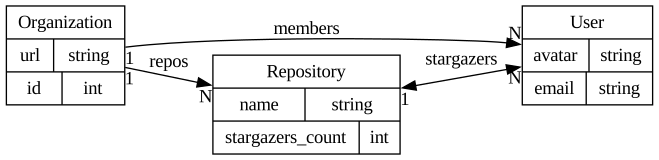
A Graphviz example of an entity relationship diagram (ERD) built with shape=record nodes and taillabel/headlabel cardinality markers.
workflow
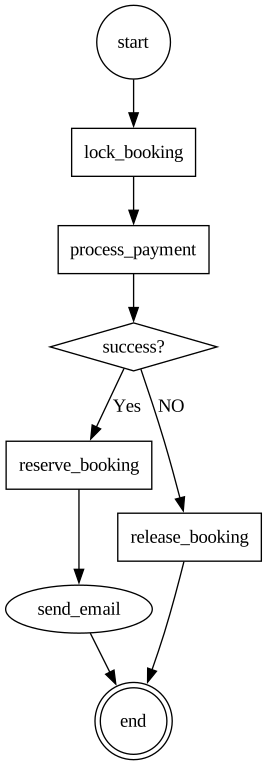
A Graphviz example of a workflow / flowchart using circle, doublecircle and diamond shapes for start, end and decision nodes.
bpmn

A Graphviz example approximating a BPMN business process diagram with rounded, filled nodes, gateway diamonds and start/end event markers.
service interaction
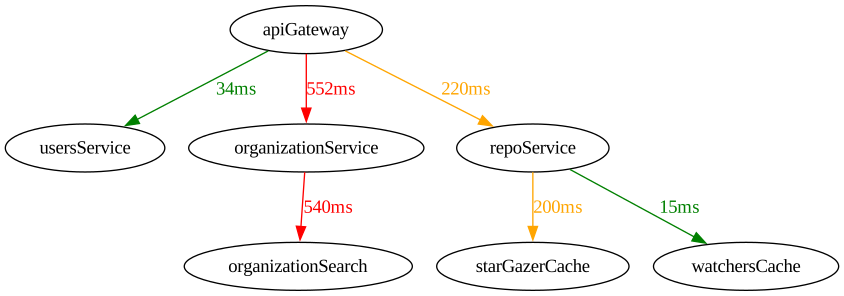
A Graphviz example of a microservices interaction diagram where edge color and label encode latency between services.
database erd

A Graphviz example of a database ERD drawn with HTML-like <table> labels and record PORTs so edges connect to specific columns.
family tree
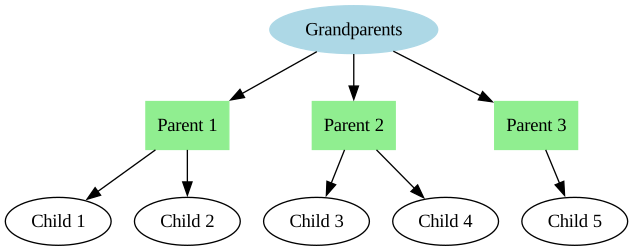
A Graphviz example of a family tree using grouped edge targets (a -> { b c }) and per-node shape/color styling.
subgraphs
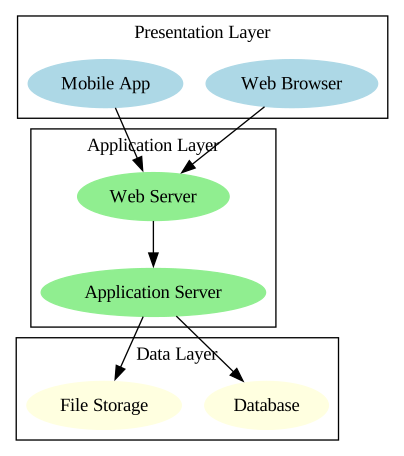
A Graphviz example of clustered subgraphs (subgraph cluster_0) that draw labelled boxes around related nodes.
decision tree
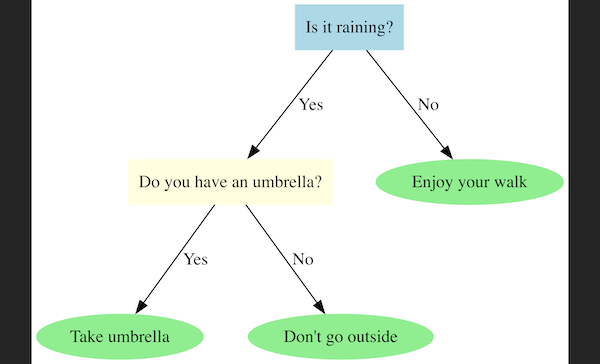
A Graphviz example of a decision tree with Yes/No labelled branches and rank=same to align the leaf nodes.