What Runs Locally in a Browser Developer Tool? A Traced Answer
The question
"Runs in your browser" is a common promise for online developer tools. It is usually true for the main job of the tool, and usually not the whole story. A page that runs your jq filter locally can still load analytics, save sessions somewhere, create share links, and send a prompt to an AI service.
We wanted to give a precise answer for DevToolsDaily instead of a slogan. So we took two real workflows, put unique marker strings ("canaries") into every piece of user content, recorded every network request and every browser storage entry, and searched all of it for those markers. We also read the code paths for the features that only work when you are signed in.
This article reports what we saw on 10 November 2026. It is an answer for these two pages, not a promise about every page on the site.
Short answer
| What you do | Where it happens | What leaves the browser |
|---|---|---|
| Run a jq filter | In the page (jq compiled to JavaScript with Emscripten, via jq-web) | Nothing with your input, filter or output. One analytics event named after the action. |
| Repair an STL file | In the page | Nothing with the file. The repaired file is built and downloaded locally. |
| Copy a share link | In the page; the state goes into the # fragment | Nothing, until you send the link to someone. Fragments aren't sent to servers. |
| Create a short link (signed in) | On the server | The shared state, when you click Create. |
| Save a session | IndexedDB in this browser | Nothing when signed out. When signed in, sessions sync to your account. |
| AI chat history | localStorage in this browser | Not stored on the server. |
| Send an AI message | On the server, then an AI provider | Your message, earlier messages in the thread and the page context you leave included. |
| Load or use the page | Analytics and ads tags | Page URLs, event names, cookies and device info. No editor content in our trace. |
The rest of the article shows how we tested each row and where the edges are.
How we tested
We used Playwright with Chromium 145 on Linux and recorded every request the page made: method, host, path, query keys, status, body size, and whether the URL or body contained a canary. We then dumped localStorage, sessionStorage, every IndexedDB store and every cookie, and searched them as well.
The canaries were random strings that can't appear by accident:
| Canary | Where we put it |
|---|---|
wrlcanaryinput7q4 | A value in the jq input JSON |
wrlcanaryexpr9m2 | A string literal in the jq filter |
wrlcanarytitle3k | The name of a saved session |
wrlcanarychat5x8, wrlcanarychatb6n | Two AI chat messages |
wrlcanaryfile6p1 | The file name and a solid name inside an STL file |
Two parts of the setup matter for reading the results:
- AI requests were captured, not forwarded. The script intercepted requests to the AI endpoint inside the browser, saved the full body, and answered with a stubbed
503, producing a "Response interrupted" message. Nothing in this test was sent to a model. We separately checked that the production endpoint answers normal requests. - Analytics IDs were redacted. Client IDs, session IDs and similar values were removed from the trace. We kept the host, path and the names of query parameters.
The jq workflow ran on the production site, three times, with the same result each time. The STL workflow ran on a local build of the next release, because the Repair STL page isn't in production yet. We ran it with the same analytics tags active, and repeated the jq workflow there with the same results.
Workflow 1: the jq playground
We opened the jq playground, typed an input containing wrlcanaryinput7q4, and ran this filter:
{who: .customer, total: (.items | add), tag: "wrlcanaryexpr9m2"}
Running the filter
The result ("total": 16, with both canaries in the output) appeared without any request carrying the input, the filter or the output. The page sent one GA4 event for the run. Its body was 381 bytes and contained the event name and page details, not the editor contents.
Share link
The share button produced a link ending in #v2=…, 231 characters long. The state is compressed with lz-string, so the canary isn't visible as plain text, but anyone with the link can decode it. Browsers don't send the part after # to the server, and the trace shows no request containing it. Analytics tags report the page URL without the fragment.
The short-link option in the same dialog is different. It is only offered to signed-in users, and it posts the shared state to our API when you click Create short link. Opening the dialog doesn't upload anything.
Saving a session
We saved the session as wrlcanarytitle3k. The input, filter and title all ended up in one row of the IndexedDB store DevToolsDailyWorkspaces.sessions. No request contained them. The page says so directly:
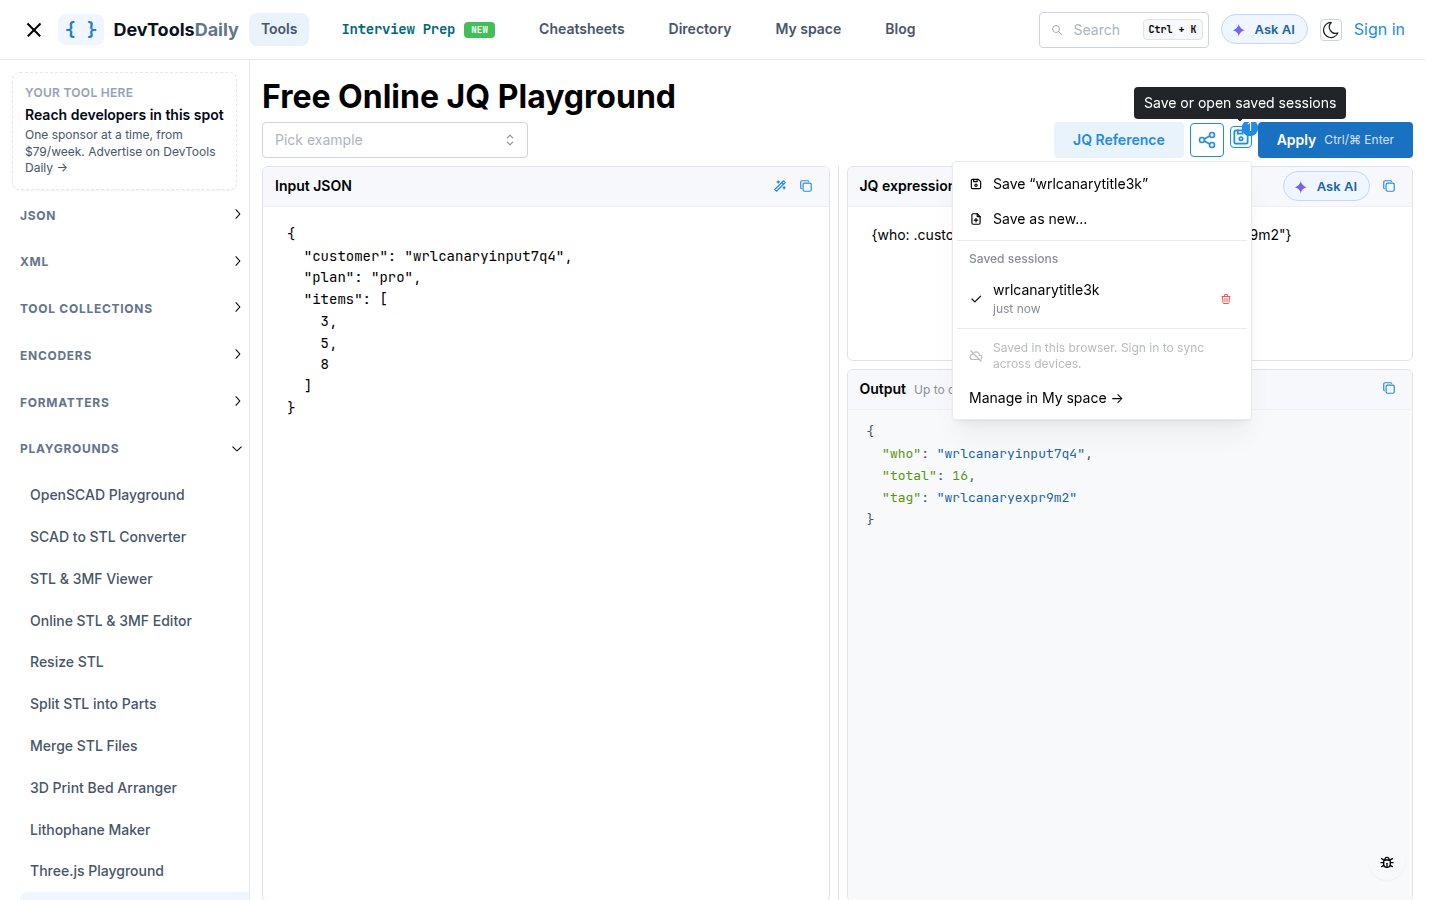
When you are signed in, a sync module is loaded and copies saved sessions to your account so they appear on other devices. It is loaded only for signed-in users, and our trace was signed out, so you won't find sync traffic in it. If you don't want a session on the server, don't save it while signed in. You can delete saved sessions in My space.
Asking the AI assistant
The chat panel says: "Messages and included context are sent to the AI service. History stays on this device." The trace agrees with both halves:
- The chat history (both chat canaries) was in
localStorageunderjq-playground-chat-history-v1, and nowhere else in browser storage. - Each message produced one
POSTtoapi.devtoolsdaily.com/v1/responses, about 5.3 KB. The body contained the instructions for the assistant, the current input JSON, the filter, the latest output and the message.
The context button lets you choose what goes along with your message. We unticked Input JSON:
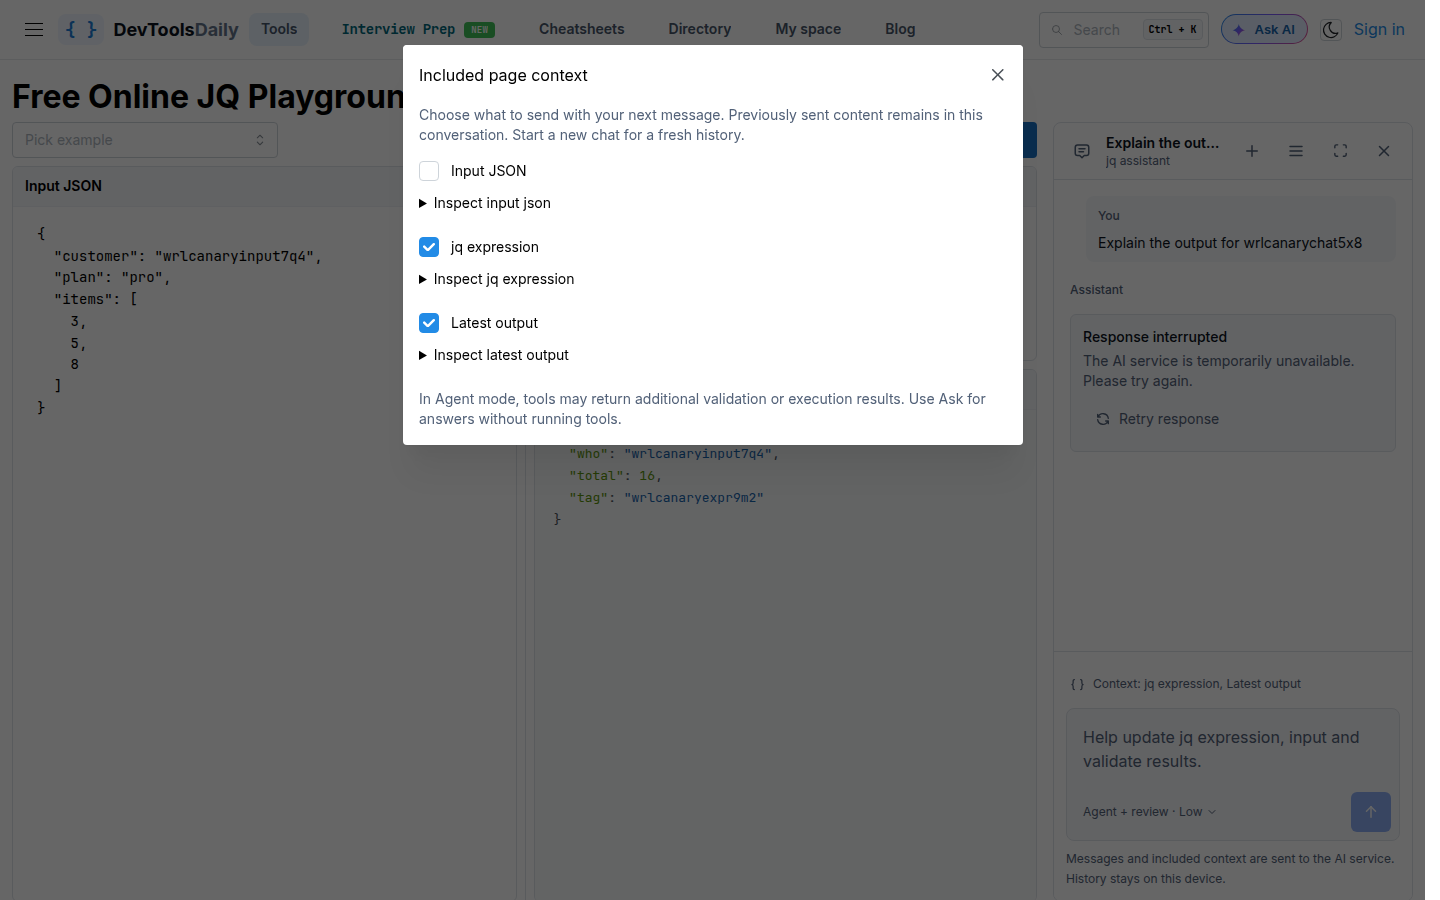
The next request no longer had an "Input JSON" section, and it told the model that some context was excluded. But it still contained wrlcanaryinput7q4, for two reasons:
- The latest output echoed the input. Our filter copied
.customerinto the result, and Latest output was still included. Excluding the input doesn't remove copies of it from other context. - Earlier messages are resent. The second request carried both chat messages, because the assistant needs the conversation so far.
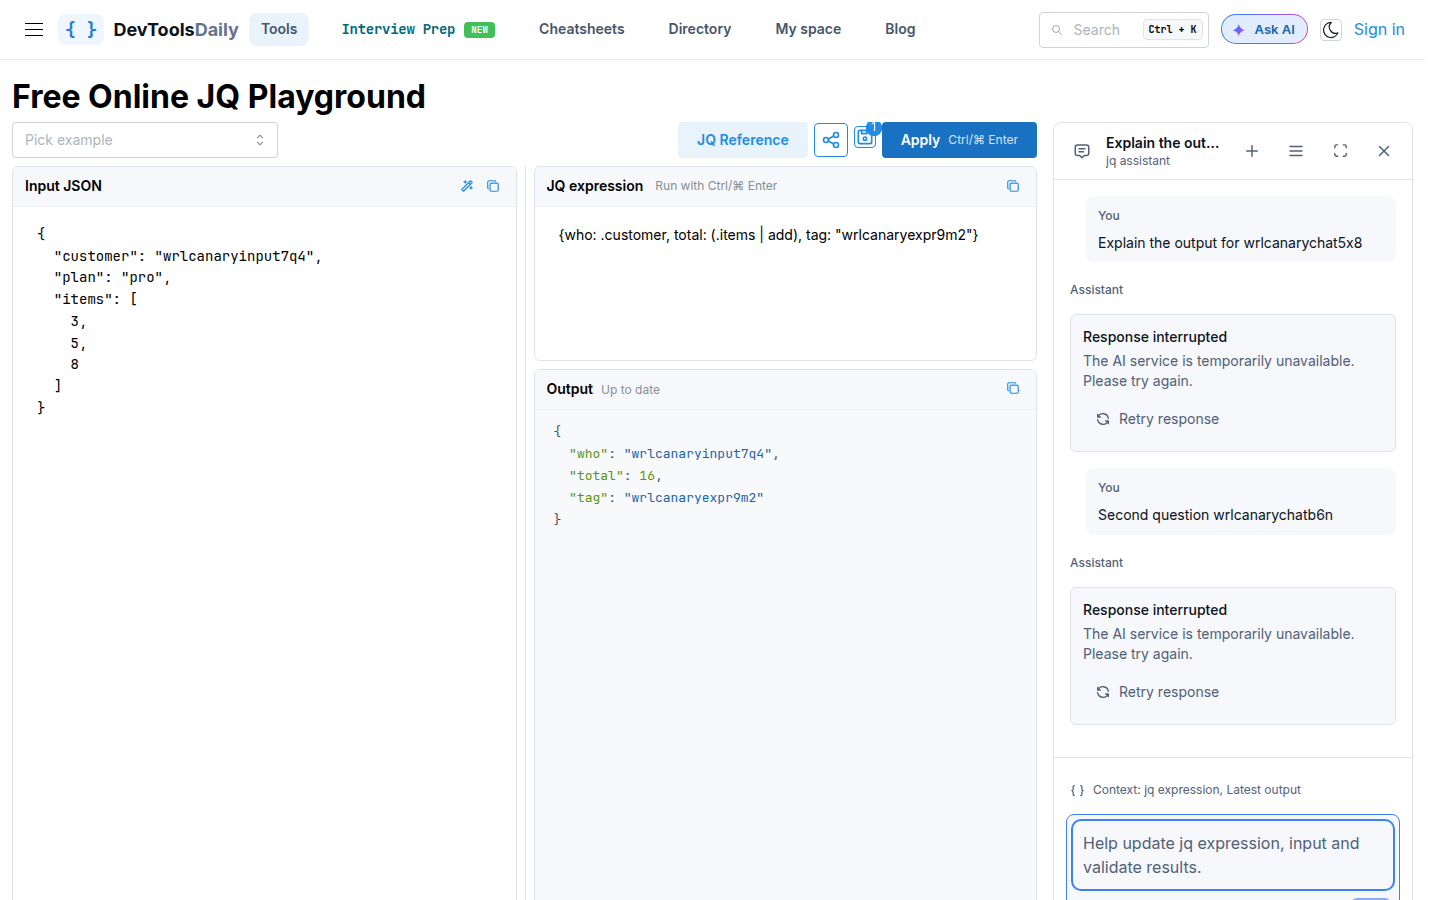
If a value must not leave your machine, untick every context item that could contain it, or start a new thread.
Our API forwards the request to an OpenAI model. On the way it removes any API key from the body and sets the model; only administrators can choose a model other than the default. The API doesn't write request bodies to its logs. Its access log records the method, path, status, timing, IP address, user agent, origin, referrer and whether the request was signed in. We don't set the store parameter, so OpenAI's default applies: a test response through the proxy came back with "store": true, which means OpenAI keeps the response under its own data-retention policy.
The page also has tool definitions named update_jq_workspace and validate_jq_expression. When the model calls one of them, your browser runs it: the jq validation happens locally, editor changes wait for your approval, and the tool result goes back to the AI service with the next request.
Workflow 2: repairing an STL file
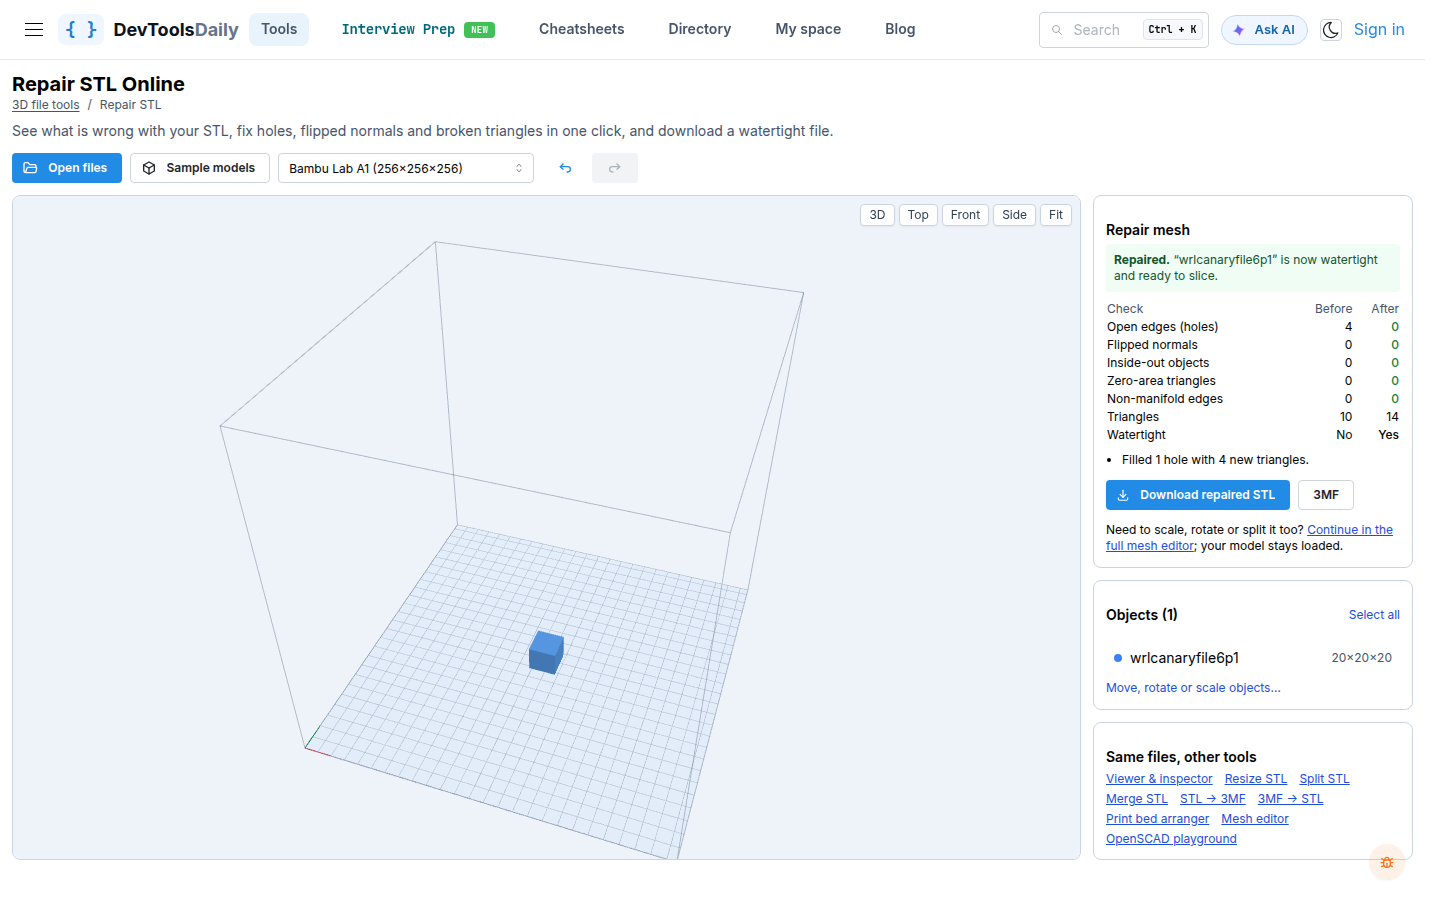
We made a small broken STL named wrlcanaryfile6p1.stl (1,253 bytes) with the canary also in its solid line, opened it in Repair STL, clicked Repair, and downloaded the result.
The repair filled one hole with four new triangles, and the browser downloaded a 784-byte wrlcanaryfile6p1-repaired.stl. No request carried the file name, the solid name or any part of the file. The page reads the file with the browser's File API, and the mesh code runs in the page. GA4 events were sent during the repair and download steps, with no file content in them.
What still leaves the browser
Even when your content stays local, loading the page talks to other services. In the production jq run, apart from the site itself, we saw:
| Host | Requests | Purpose |
|---|---|---|
www.google-analytics.com | 10 | GA4 page views and events |
www.google.com, googleads.g.doubleclick.net, ad.doubleclick.net | 62 | Google Ads conversion and remarketing tags |
www.googletagmanager.com | 4 | Tag loader |
queue.simpleanalyticscdn.com, scripts.simpleanalyticscdn.com | 6 | Simple Analytics page views |
firebaseinstallations.googleapis.com, firebaseremoteconfig.googleapis.com | 4 | App configuration and feature flags |
fonts.googleapis.com | 2 | Fonts |
api.devtoolsdaily.com | 4 | The two AI messages, plus a site-banner request on each page load |
None of these requests contained a canary, apart from the two AI messages to api.devtoolsdaily.com. The cookies set were _ga, _ga_7DG5MW40ZJ and _gcl_au on .devtoolsdaily.com, and IDE on .doubleclick.net.
One detail we didn't expect: opening the AI panel adds ?chat=chat_<timestamp>_<random> to the page URL so the thread survives a reload. Analytics and ads tags report the page URL, so 11 requests to Google Analytics and Google Ads included that thread ID. It is an identifier, not the chat content, but it does let those services see that a page view belongs to a particular chat thread.
What this means in practice
- Computation. The tool itself runs in your browser for these workflows. Your input, filter and file didn't appear in any request.
- Storage. Saved sessions and chat history live in your browser until you sign in (sessions) or clear site data. Signed-in saves sync to your account.
- Sharing. A
#share link holds your data in the link itself. Anyone with the link can read it. A short link stores it on our server. - AI. An AI message sends the conversation and whatever context is ticked to our API and on to OpenAI. Unticking one item doesn't remove copies of its data from other items.
- Analytics. Analytics and ads tags see page URLs, event names and device data, but not editor contents.
Limitations
- Two workflows on one site on one day, with Chromium 145 on Linux, signed out. Other pages may behave differently, and future releases can change the details.
- The signed-in features (workspace sync, short links) were checked by reading the code, not by tracing a signed-in session.
- The STL test ran on a development build because that page isn't released yet.
- A canary search only finds data copied as text. Compressed or encoded copies (like the share fragment) need their own check, which we did only for the share link.
- What happens on servers we don't run (Google, OpenAI) is described from their responses and public settings, not observed.
Try it yourself
- Open your browser's developer tools on the Network tab and tick Preserve log.
- Put a unique word into a tool's input, run it, and use the Network search (Ctrl/⌘+F in the Network panel) to look for the word.
- Check Application → Local storage and IndexedDB to see what the page saved.
Related guides:
- Profile CSV and JSON files without uploading them
- What JSON loses in CSV and type generation
- JQ cheat sheet