One Architecture, Three Diagram Tools: Mermaid vs Graphviz vs PlantUML
The question
Most comparisons of Mermaid, Graphviz, and PlantUML look at syntax: how a node or an arrow is written. In practice, a diagram is written once and then changed many times. So we asked a narrower question:
If you draw the same small architecture in all three tools and then make the same change, how much does the source change, and how much does the picture move?
We drew one diagram in each tool, then added a Redis cache. We rendered both versions with the same in-browser engines that this site's playgrounds use and measured the results. All sources and renders are linked below, so you can open any version in a playground and check it.
The setup
The architecture is a small order system:
- A Web app calls an API gateway over HTTPS.
- A Backend group holds the gateway, an Auth service, and an Orders service.
- A Data group holds the Orders DB and an Order events queue.
- An Email worker consumes the events.
Each version draws left to right, uses the tool's own grouping construct (Mermaid subgraph, Graphviz cluster_* subgraph, PlantUML package), and uses the closest built-in shape for the database. PlantUML has a native queue shape; Mermaid 10.9 and Graphviz don't, so the queue is a plain box there. We kept default themes and didn't tune any layout options.
The change: add a Redis cache node (a cylinder or database) inside the Data group, and an Orders service → Redis cache edge labeled read-through.
Engines used to render (the same ones behind the site's playgrounds):
| Tool | Engine in the playground | Version |
|---|---|---|
| Mermaid | mermaid npm package | 10.9.0 |
| Graphviz | @viz-js/viz (WebAssembly) | 3.2.3, which reports Graphviz 9.0.0 |
| PlantUML | @plantuml/core (in-browser, no Java or server) | 1.2026.6, which uses its own bundled Graphviz 14.1.1 for layout |
Version 1 in each tool
Mermaid
flowchart LR
  web[Web app]
  subgraph backend[Backend]
    gw[API gateway]
    auth[Auth service]
    orders[Orders service]
  end
  subgraph data[Data]
    db[(Orders DB)]
    queue[Order events]
  end
  worker[Email worker]

  web -->|HTTPS| gw
  gw -->|verify token| auth
  gw -->|REST| orders
  orders -->|SQL| db
  orders -->|OrderPlaced| queue
  queue -->|consume| worker
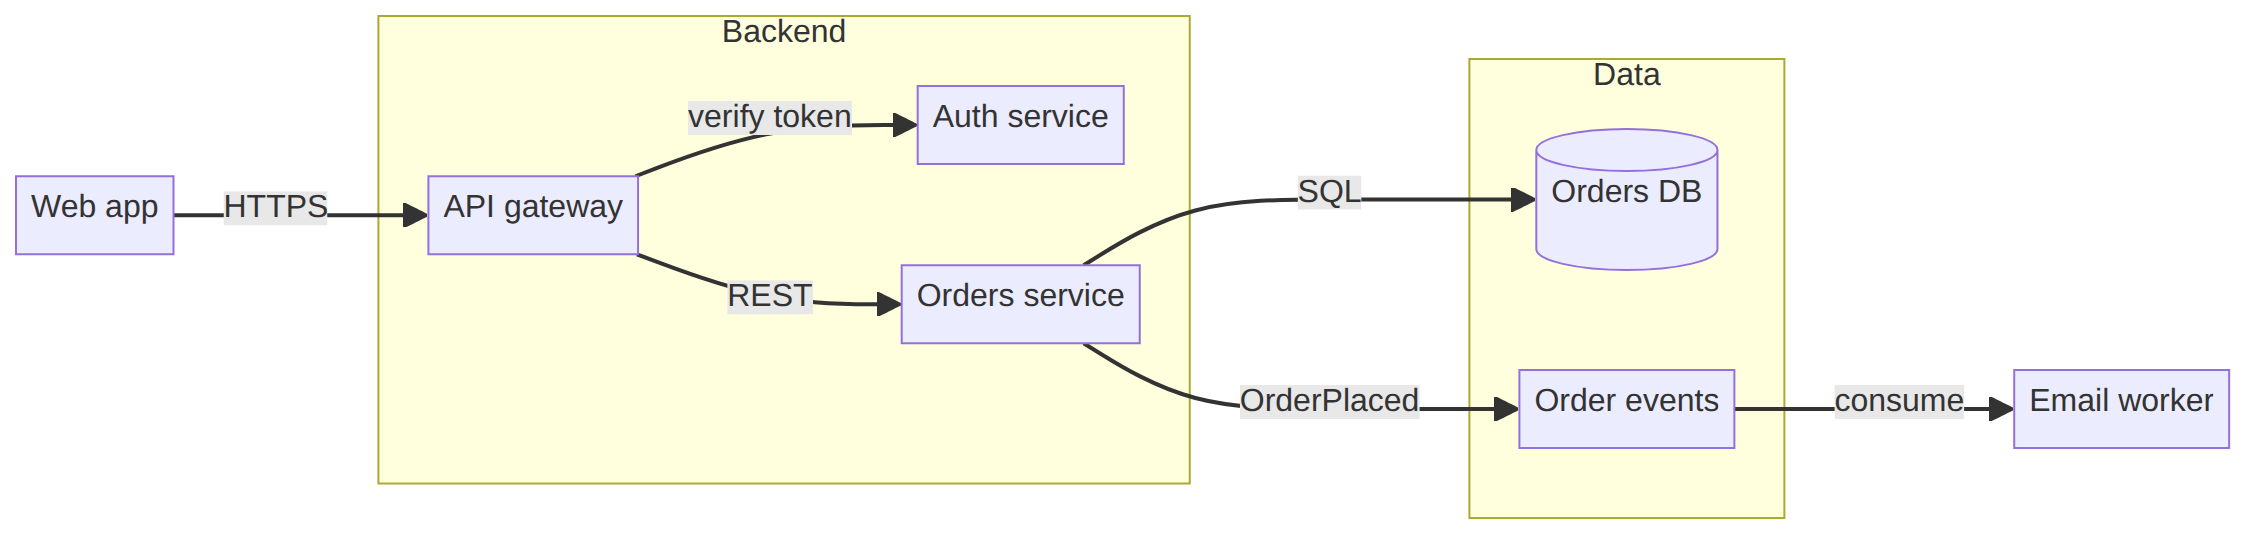
Open version 1 in the Mermaid playground
Graphviz (DOT)
digraph architecture {
  rankdir=LR;
  node [shape=box, style=rounded];

  web [label="Web app"];
  subgraph cluster_backend {
    label="Backend";
    gw [label="API gateway"];
    auth [label="Auth service"];
    orders [label="Orders service"];
  }
  subgraph cluster_data {
    label="Data";
    db [label="Orders DB", shape=cylinder];
    queue [label="Order events"];
  }
  worker [label="Email worker"];

  web -> gw [label="HTTPS"];
  gw -> auth [label="verify token"];
  gw -> orders [label="REST"];
  orders -> db [label="SQL"];
  orders -> queue [label="OrderPlaced"];
  queue -> worker [label="consume"];
}
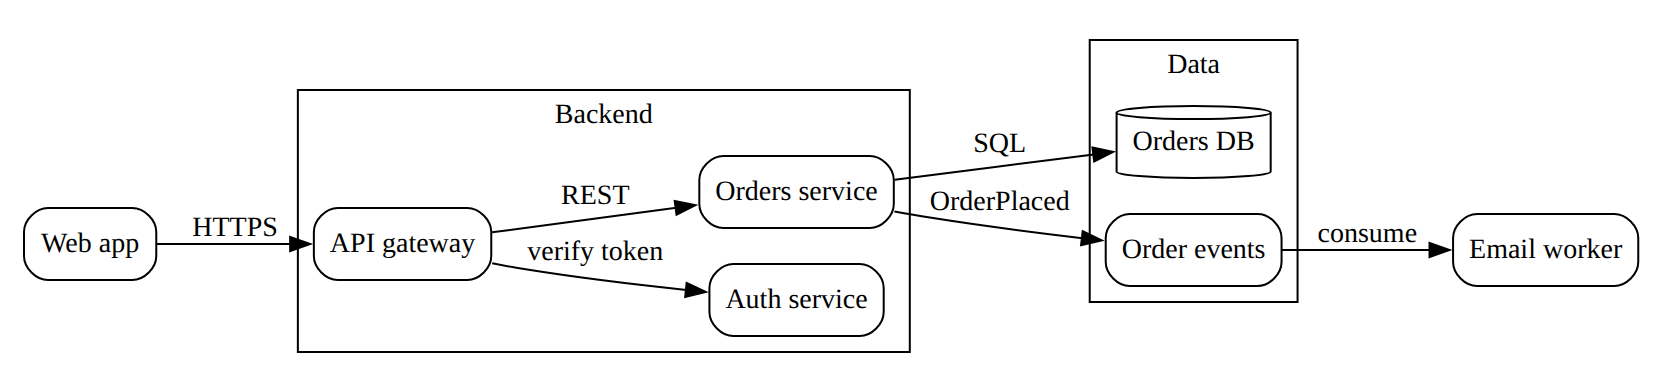
Open version 1 in the Graphviz playground
PlantUML
@startuml
left to right direction
rectangle "Web app" as web
package "Backend" {
  rectangle "API gateway" as gw
  rectangle "Auth service" as auth
  rectangle "Orders service" as orders
}
package "Data" {
  database "Orders DB" as db
  queue "Order events" as queue
}
rectangle "Email worker" as worker

web --> gw : HTTPS
gw --> auth : verify token
gw --> orders : REST
orders --> db : SQL
orders --> queue : OrderPlaced
queue --> worker : consume
@enduml
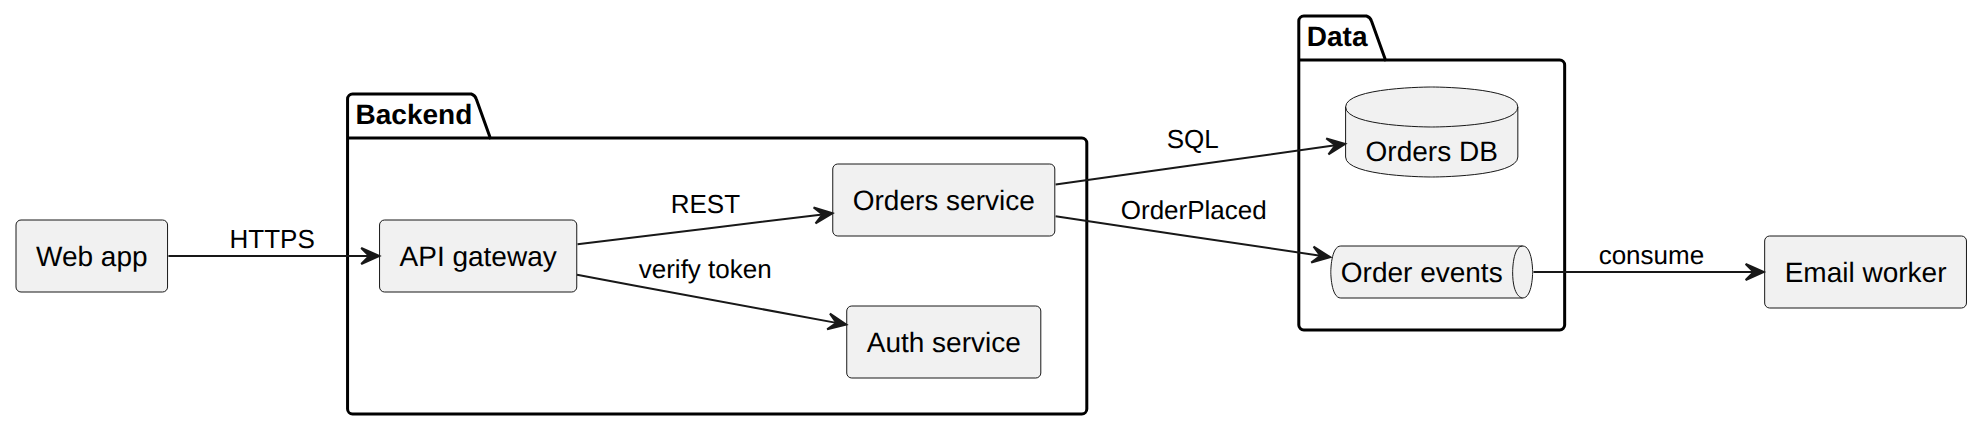
Open version 1 in the PlantUML playground
The change: adding a cache
In all three tools, the edit is the same: one line inside the Data group and one line in the edge list. Here is the diff -u output for each.
Mermaid
   subgraph data[Data]
     db[(Orders DB)]
+    cache[(Redis cache)]
     queue[Order events]
   end
@@
   orders -->|SQL| db
+  orders -->|read-through| cache
   orders -->|OrderPlaced| queue
Graphviz
   subgraph cluster_data {
     label="Data";
     db [label="Orders DB", shape=cylinder];
+    cache [label="Redis cache", shape=cylinder];
     queue [label="Order events"];
   }
@@
   orders -> db [label="SQL"];
+  orders -> cache [label="read-through"];
   orders -> queue [label="OrderPlaced"];
PlantUML
 package "Data" {
   database "Orders DB" as db
+  database "Redis cache" as cache
   queue "Order events" as queue
 }
@@
 orders --> db : SQL
+orders --> cache : read-through
 orders --> queue : OrderPlaced
Version 2 renders
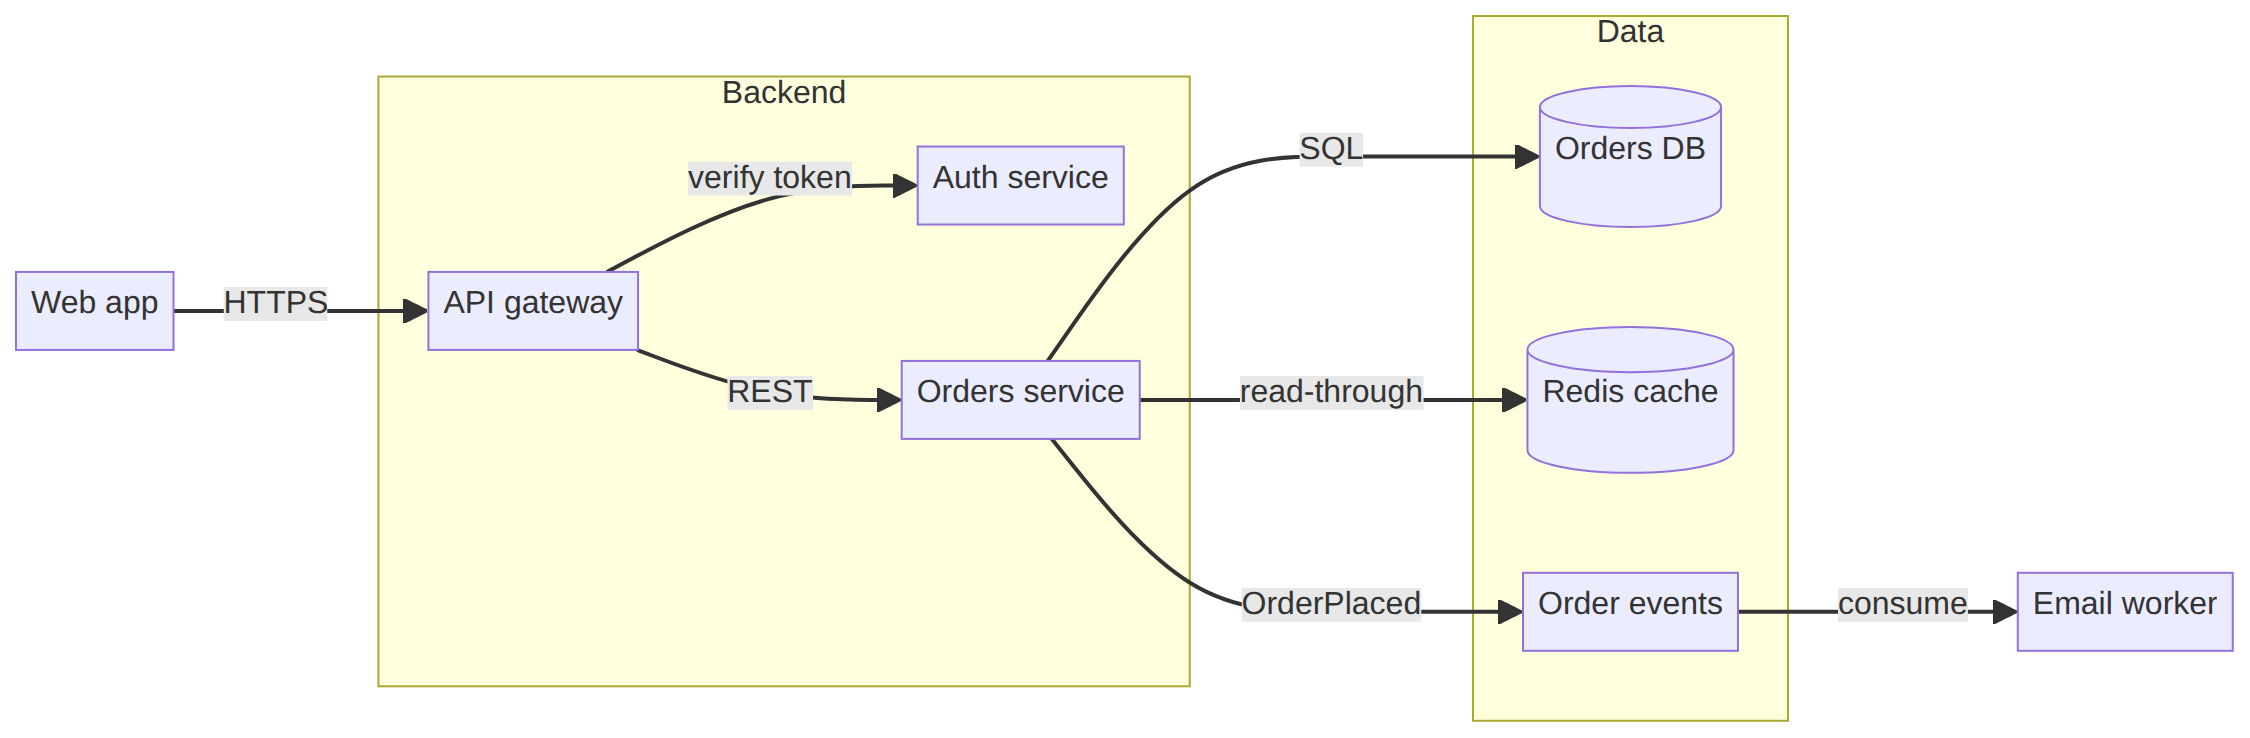
Mermaid, version 2. Open in the playground
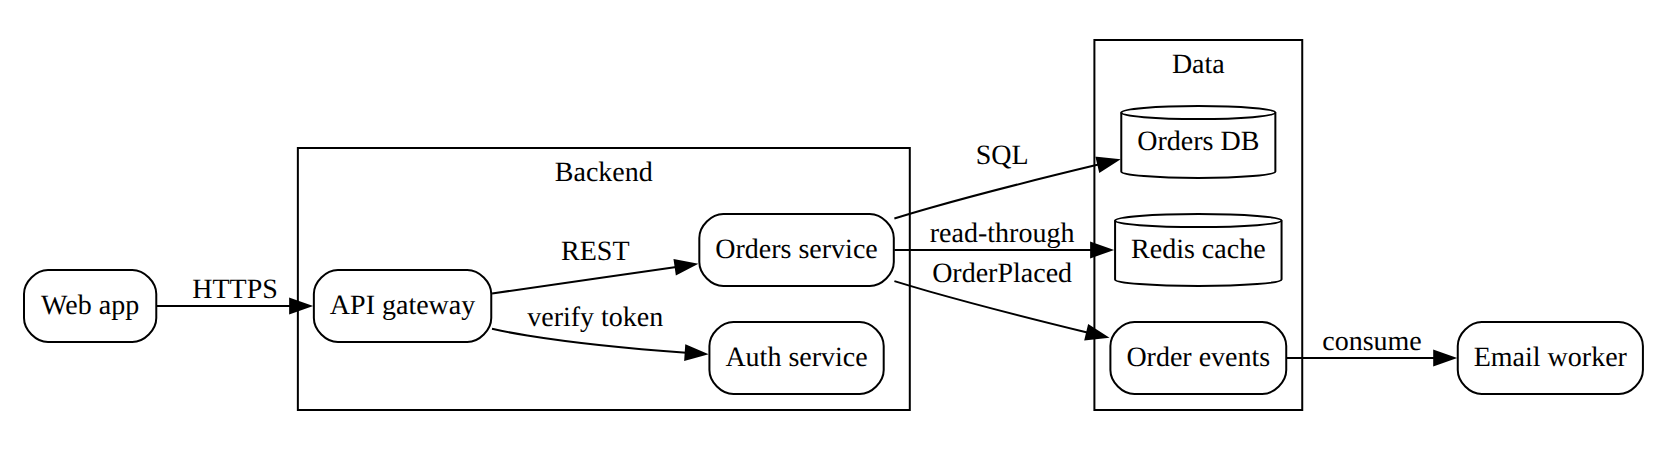
Graphviz, version 2. Open in the playground
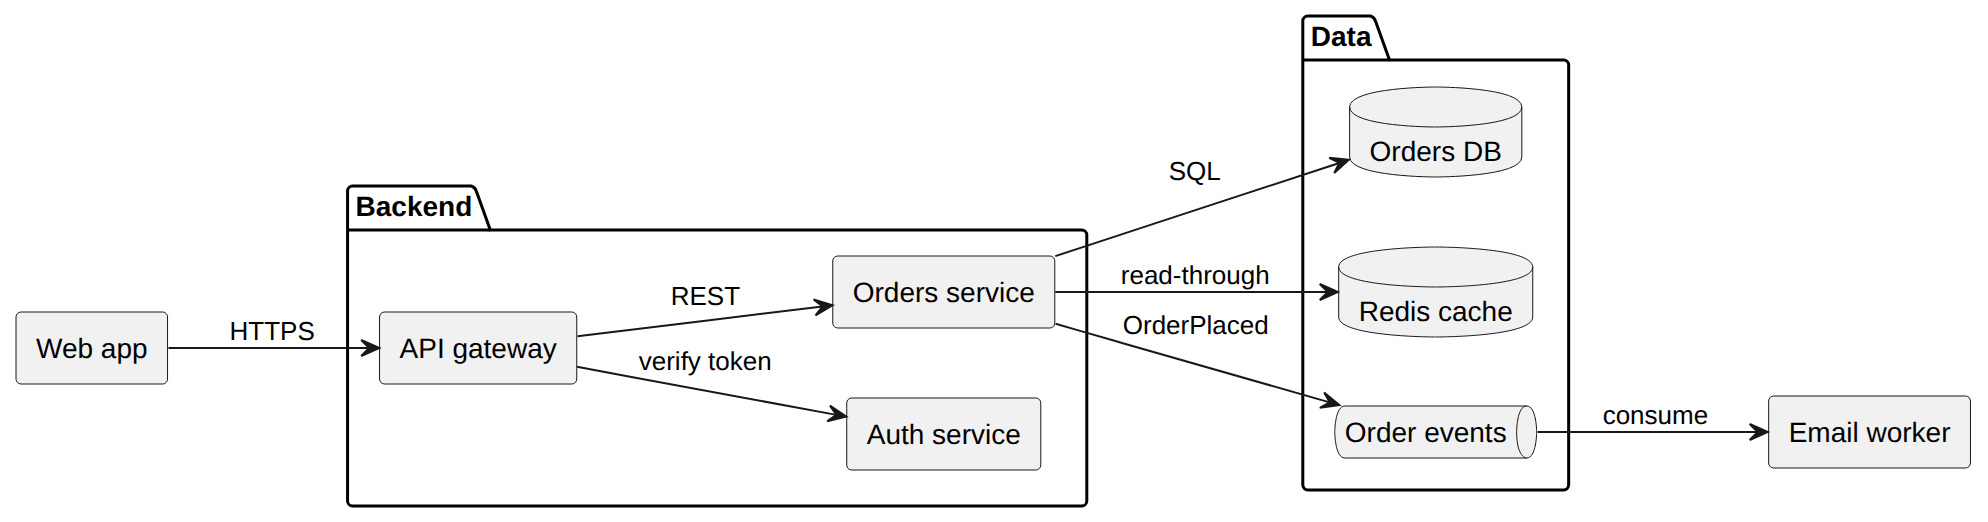
PlantUML, version 2. Open in the playground
What we measured
Source size. We counted non-blank lines and bytes, then the lines added or removed between versions.
| Tool | v1 lines / bytes | v2 lines / bytes | Diff |
|---|---|---|---|
| Mermaid | 18 / 379 | 20 / 437 | +2 / −0 |
| Graphviz | 23 / 619 | 25 / 710 | +2 / −0 |
| PlantUML | 20 / 458 | 22 / 524 | +2 / −0 |
Rendered size and layout movement. We measured sizes in diagram units (SVG user units, before any zoom). For movement, we took each node's center and measured it relative to the Web app node, so that the whole picture simply re-centering doesn't count as movement.
| Tool | v1 size | v2 size | Height change | Largest vertical shift | Largest horizontal shift |
|---|---|---|---|---|---|
| Mermaid | 1107 × 251 | 1108 × 352 | +101 (+40%) | Orders DB −69, Order events +54, Auth service −17 | 2 |
| Graphviz | 815 × 180 | 817 × 209 | +29 (+16%) | Orders DB −31, Order events +23, Backend nodes ≤ 2 | 2 |
| PlantUML | 975 × 199 | 977 × 245 | +46 (+23%) | Orders DB −46, Order events +34, Backend nodes 0 | 2 |
What we saw
- The source change was the same size everywhere. Each tool needed exactly two added lines and no edits to existing lines. For a change like this, the choice of tool barely affects the diff a reviewer sees. Graphviz is the most verbose (about 60% more bytes than Mermaid: 619 vs 379), mostly because of
label="…"attributes. - All three placed the cache in the same spot. Every engine put Redis cache between Orders DB and Order events inside the Data group, and kept the left-to-right order of columns. No node moved sideways by more than 2 units.
- Mermaid's picture moved the most. Its diagram grew 40% taller. Orders DB and Order events moved apart by over 120 units, and Auth service also moved inside the Backend group, even though nothing in Backend changed. Mermaid also left a lot of empty space at the bottom of the Backend group in both versions.
- Graphviz stayed the most compact. It grew only 16% taller, and the Backend nodes stayed within 2 units. The trade-off is crowding: in version 2, the
read-throughandOrderPlacededge labels sit almost on top of each other. - PlantUML kept the unchanged group perfectly still. The Backend nodes didn't move at all relative to Web app. Only the Data group grew. It is also the only one of the three with a dedicated queue shape.
If you keep diagrams in a repository and review them as screenshots, Graphviz and PlantUML gave the most stable before/after pictures here. If you review them as source diffs, all three were equally small.
Method and limitations
- One diagram, one change. This is a single small diagram with seven nodes and one kind of edit. A larger diagram, or edits like renaming a group or moving a node between groups, could behave differently.
- Default settings. We used each tool's default theme and layout. Graphviz options like
nodesep, or Mermaid's ELK renderer, would change the numbers. - Specific engines. The results come from the engine versions in the table above, run in Chromium on one Linux machine through this site's playgrounds. PlantUML's own Java build or a newer Mermaid may lay things out differently.
- What "movement" means. We measured the center of each node's bounding box in SVG units, relative to the Web app node. The measure ignores how edges are routed and where labels go, which is why we describe label crowding separately.
- Shapes aren't identical. Each tool used its nearest built-in shape, so the boxes are not the same size across tools. Compare the changes within each tool, not absolute sizes across tools.
All six source files are in this article's assets: v1.mmd, v2.mmd, v1.dot, v2.dot, v1.puml, v2.puml.
Try it yourself
- Edit any version in the Mermaid playground, the Graphviz playground, or the PlantUML playground.
- For a feature-level comparison of the first two tools, see Graphviz vs Mermaid.